Established in 1952 by the Mississippi Legislature, the Public Employees Retirement System (PERS) is a defined benefit plan designed to provide benefits to the state’s public sector workforce. PERS provides benefits to eligible employees of state agencies, municipalities, counties, universities, community colleges, public schools, and other participating public entities.
There are two categories of pension programs: defined benefit plans and defined contribution plans. Defined contribution plans, such as traditional 401(k) accounts, are widely used in the private sector. Typically, both the employee and employer (though not required) contribute to the employee’s account as a specific percentage of employee gross wages. Contributions are generally pre-tax, whereas withdrawals are taxable.
Defined benefit plans, such as PERS and virtually all other public pensions, including Social Security, function similarly in that both the employee and employer contribute a specified percentage of employee wages to the employee’s retirement account.
The key distinction between traditional private sector 401(k) or IRA accounts and public pensions is in how benefits are handled.
In reality, except for the employer contribution and pre-tax feature of 401(k) accounts, these instruments aren’t technically benefits. Rather, 401(k) plans are simply special savings accounts, where the investment of funds in the account is controlled by the employee. After age 59 and a half, the account holder can withdraw as much as they want from the accumulated funds, at any time they choose. 401(k) plans have a finite value. Retirees have access to the funds accumulated during employment until the account is depleted.
Unlike defined contribution plans, defined benefit plans, such as Mississippi’s PERS, pay benefits for life – regardless of the amount a member employee and their employer contributed to the program. Base service benefits are determined according to a formula that considers the highest four years of salary and the number of years of service. Benefits aren’t directly tied to contributions accumulated while the member is working.
To further illustrate the economic challenge with defined benefit plans, consider Ida May Fuller, the first Social Security recipient. Ms. Fuller worked for three years under the Social Security program. She paid a total of $24.75 on her salary from 1937-1939. She retired at age 65 in November 1939 and began collecting benefits in January 1940, receiving check “00-00-001.” Her monthly benefits continued until she died at the age of 100 in 1975. Her 35 years of benefits totaled $22,888.92 — over 900 times what she paid in.
Working with third-party consultants, the PERS 10-member Board of Trustees is responsible for maintaining the financial stability of the program by ensuring “actuarial soundness” and “sustainability” of the plan. The board establishes and maintains a comprehensive funding policy, including metrics used to track the system’s performance and overall stability. Additionally, the board sets employer and contribution rates, establishes an assumed rate of return on the trust’s assets, and makes recommendations for plan adjustments to the legislature.
The current funding policy, last revised in 2018, set a goal to steadily increase the plan’s funded ratio, reaching 100% funding by 2047. As of today, that goal seems ambitious. PERS is facing significant economic headwinds. The three primary financial metrics used to measure the program’s health are in red signal-light status, as indicated by the chart below:

Let’s review these three metrics. The funded ratio simply measures the value of assets against the actuarial accrued liabilities at a point in time. Cash flow as a percentage of assets is calculated as the contributions to the trust minus benefits paid out of the trust as a percentage of assets at the beginning of a year. The ADC/FCR ratio is a comparison of the actuarially determined contribution (ADC) to PERS’ fixed contribution rate (FCR). The actuarially determined contribution rate is simply the amount needed to fund benefits. An ADC/FCR ratio above 100% indicates that the plan’s contribution rate is not sufficient to cover future benefits plus unfunded liabilities.
So how did PERS get here?
First, it should be noted that PERS is not facing immediate or short-term risk in meeting its financial obligations to members and retirees. However, action is needed to achieve long-term financial stability of the system. As is the case with most lingering challenges, acting today is less expensive than kicking the financial can down the road, when draconian reforms could be required to preserve PERS for future beneficiaries.
The short answer is that the historical funding policy employed by PERS, adopted by the board, is problematic for the long-term financial sustainability of the plan. In 1999, for example, the legislature began to increase benefits without offsetting these additional expenses with adequate funding measures, such as increasing contribution rates or the target return on PERS’ investments. Rather, funding was achieved – albeit on paper – by an accounting maneuver known as “amortization,” a word typically applied to loans or intangible assets. Amortization is an accounting concept that just means spreading out costs over a period of time.
In the context of PERS, as is the case with all defined pension plans, amortization is used to account for discrepancies between actual and expected return on plan assets. The additional benefits enacted by the legislature were not funded by additional income, but rather by extending the amortization period – an approach fraught with risk, as warned by the legislative Performance Evaluation and Expenditure Review Committee (PEER) in 1998.
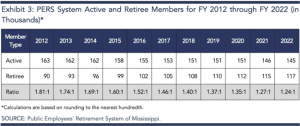
PERS, like virtually all defined benefit plans, is a “pay as you go” program, meaning current retiree benefits are funded largely by current contributions paid by employers and active employees. The ratio of active members (paying into the system) to retired members (drawing benefits out of the system) is a key indicator of the plan’s financial health. The ratio has declined by more than 31% over the past 10 years, from 1:81:1 in 2012 to 1:24:1 in 2022. See the chart below:
The trend seen in the chart tells the story. The number of active employees has steadily decreased – by 18,000 over the past 10 years while the number of retirees has trended upward by 27,000 over the same period. That’s bad news for PERS’ pay-as-you-go model.
Additionally, retirees are living longer. 74 retirees or beneficiaries are over the age of 100, with an average age of 101.8 and drawing benefits for an average of 36 years.
It’s interesting to note that the conservative mantra to “shrink the size of government,” which often, if not almost always, involves reducing the government payroll, exerts pressure on PERS’ finances, which then falls back on the taxpayers to correct.
How can PERS be fixed?
The solution to PERS’ financial woes is quite straightforward and analogous to how you would manage a shortfall in your household finances. The potential solution can be characterized as a multiple-choice question with three options:
- Increase revenue
- Decrease expenses
- Both 1. and 2.
Let’s explore each of these options.
How can PERS increase revenue?
Over the last 30 years, most of PERS revenue has been derived from earnings on the plan’s investments (55%). Employer (taxpayer) contributions account for 28% of plan revenues and member contributions make up 17% of total inflows.

PERS could generate more revenue by improving its return on its investment portfolio. Of course, markets are volatile, that’s a bit easier said than done. For fiscal year 2022, PERS experienced a loss of 8.54% on plan investments, resulting in a decrease of assets of approximately $4.4 billion, from $35.6 billion to $31.2 billion. Over the past 30 years, PERS has achieved a 7.95% rate of return. One positive about the Federal Reserve’s interest rate hiking campaign over the past two years is that fixed-income instruments, such as U.S Treasury securities, are yielding higher returns, allowing PERS’ investment managers to rebalance plan assets in a less risky fashion to achieve the target rate of return.
The average target rate of return for U.S. state pension plans is 6.9%. The median is 7.0%.
Currently, employers pay 17.4% of employee wages and employees contribute 9% of their gross pay to the fund. State statute empowers the PERS Board of Trustees to set both the employer and employee contribution rates. In December 2022, the board voted to increase the employer contribution rate by five percentage points to 22.4%, effective October 1, 2023. Many legislators and local leaders expressed concerns about the increase, especially with elections approaching.
Responding to concerns expressed about the increase by local governments, the board and legislature proposed phasing in the increase, by 2% each fiscal year, beginning July 1, 2024, and in subsequent years until the rate equals the amount recommended by the plan’s actuary and approved by the board – ultimately to 10% based on current actuary recommendations.
Remember, taxpayers effectively cover employer contributions. As the rate increase is phased in, Mississippi taxpayers will be on the hook for a staggering annual cost of $345 million per 5% increase or a total of ~$700 million once fully implemented to 27.4%.
The legislature can simply appropriate funds to cover the additional expense associated with raising the employer contribution rate paid by state agencies. However, other participating entities, namely school districts and local governments, would be required to find the additional money in revenues they receive from their sources — property taxes (counties, school districts, and municipalities) and sales taxes (municipalities only).
Another option is to increase the employee contribution rate, currently at 9% since 2010. However, prior opinions from the state’s attorney general hold that the employee rate should not be increased without a corresponding enhancement in benefits, which would require action by the legislature. So that doesn’t offer much to stabilize the fund.
The average employer contribution rate for state and local employers is 29.82%. In some states, some or all public sector employees do not participate in Social Security. Employees covered by Social Security contribute 5.98% of their gross wages to their pension funds. While employees who do not have access to Social Security contribute an average of 8.07% of their pay.
How can PERS decrease expenses?
Well, the primary expenses incurred by defined benefit pension plans are, of course, benefits. Talk about a sensitive subject.
There are two components of retiree benefits in PERS: Service (base) Retirement Benefits and Cost-of-Living Adjustment (COLA), commonly known as the “Thirteenth Check.”
The base benefit is calculated using a formula that considers the number of years of service (employment) and average compensation, calculated based on the four highest years of salary. It is not required that the years be consecutive. Members qualify for PERS retirement benefits when they attain age 60 and are vested or they have been a member for either 25 or 30 years, depending on their Retirement Tier.
Presently, PERS members belong to one of four tiers, determined by the employee’s date of hire and entry into the program. Each tier sets the framework for retirement benefits including the number of years of service credit necessary to earn retirement, vesting period, formula used in calculating benefits, and various benefit options.
Retirees are eligible for Cost-of-Living Adjustment (COLA) benefits after receiving base benefits for at least one full fiscal year. The COLA is computed on a simple interest basis at a rate of 3% for each full year of retirement before the age of 55 for Retirement Tiers 1-3 or age 60 for Retirement Tier 4. For each year of retirement after the age of 55 (Tiers 1-3) and 60 (Tier 4), the 3% rate is compounded.
Like PERS, a key feature of Social Security is increasing general benefits through COLAs. Unlike PERS, Social Security COLAs are based on increases in the cost of living, as measured by the Consumer Price Index (CPI). In many years, such as 2009, 2010, and 2015, the Social Security COLA has been zero, consistent with the CPI, which was also near or below zero.
The PERS COLA methodology is based on the formula provided above and is not tied to the cost of living. The official PERS Member Handbook includes a COLA example, illustrating the calculation for a member who retired at age 52 and has been receiving retirement benefits for 16 full fiscal years. The calculation yields a $5,026.50 FY COLA benefit for Tiers 1-3 and $4,561.20 for Tier 4.
If the PERS COLA were based on the CPI, and the member retired in 2007, the COLA would be $4,360 after 16 full years of retirement. If the member retired in 2002, the COLA would be $3,629 again, after 16 full years of retirement.
The bottom line is that the PERS COLA benefit is more generous than a COLA tied to the CPI, consistent with the methodology utilized by the Social Security Administration.
Total benefits paid in 2022 were $3 billion consisting of $2.18 billion in service benefits and $825 million in COLA payments. The average annual benefit paid by PERS in 2022 was $26,258.
What is likely to happen?
Below are the options the legislature and PERS are likely to consider and debate listed in order of likelihood of action:
Increase the employer contribution rate: That’s already been approved by the PERS Board and awaits approval from the legislature.
Create a new Retirement Tier: The PERS Board recently directed the PERS staff to design a Tier 5 for new employees. The board requested that Tier 5 include a new four-year vesting feature, instead of the eight-year found in all current Tiers. Tier 5 would also exclude guarantees for COLAs. This is likely to gain approval from the legislature. The risk is that working for state government would become less attractive. Would the state be able to meet its future workforce needs?
Transfer funds from the state’s cash reserves or General Fund into PERS: PERS has already floated the idea of a $350 million-a-year transfer for up to 25 years. Like raising the employer rate, which is funded by taxpayers, this option would likely stoke dissatisfaction from taxpayers.
Increase the target rate of return on assets: As previously discussed, the PERS Board recently voted to decrease the target rate of return. The board could certainly reverse that decision and increase the target rate, but markets are volatile and there are no guarantees that actual results would achieve the target rate adopted.
Increase the employee contribution rate: Any increase in the employee contribution rate is highly unlikely because that would require a corresponding increase in benefits, as discussed earlier, which simply offsets the infusion of additional revenue produced from the increase.
Adjust benefits: The live wire option. Any mere mention of adjustments to either the Service Benefit or Cost-of-Living-Adjustment (the so-called “13th check”) draws severe fury from members – especially existing retirees or those within striking distance of retiring. During a recent meeting of the Legislative Budget Committee and PERS Executive Director Ray Higgins, the possibility of adjusting the annual COLA framework or temporarily suspending the annual 3% increase, effectively freezing the COLA, was discussed. But the notion didn’t get any serious traction – for now.
What we might see is the requirement that retirees receive their 3% Cost-of-Living-Adjustment as part of their monthly benefit instead of an annual “13th check,” which is a current option under the program.
The likely scenario is that PERS and the legislature will cobble together an approach consisting of some combination of multiple options from the aforementioned list.
One thing is for sure, PERS’ financial woes are not going to be resolved on their own. Placing the program on a path to long-term sustainability is going to require a combination of financial creativity, prudence, and fairness. I’m confident that PERS will be a high-priority issue in the next legislative term.
The views expressed by contributors are their own and not the views of SuperTalk Mississippi Media.


